*** Updated 2nd June 2024 ***
Summary
This article looks at the CO2 from construction of EWR Bedford to Cambridge (CS3), estimated by EWRCo.’s technical partner, but also, as a cross check, scaled from government HS2 Phase 2a estimates. We also look at that for the new housing assumed by the EWRCo. Economic and Technical report from May 2o23. We compare those CO2 emissions with the savings likely from modal shift from road to rail over a 60 year period. The CO2 from construction exceeds that saved from modal shift by orders of magnitude. Although the analysis here is approximate, it is very unlikely that the EWR project would reduce CO2 emissions. If you just want the answer have a look at table 1 below.
| EWR CS3 CO2 | Unit:TCO2e | ||
| Construction | Modal Shift | Net | |
| Existing Residents | 322,500* | -5,403 | 317, 907 |
| EWR Houses | 8,125,714 | -18,523 | 8,107, 191 |
| Total | 8,448, 214 | -23,926 | 8, 424, 288 |
If you want to know more about where these numbers came from, read on.
Which transport schemes have the lowest carbon emissions per passenger mile?
Table 2 below is taken from this article and shows that electric trains especially when heavily used (like Eurostar) and perhaps partly powered by French nuclear reactors have really low emissions per passenger mile. The average figure for Network Rail is also good, as are electric cars. We clearly need to decarbonise transport and switching to electricity is a good way to do that especially if the electricity comes from renewable sources or nuclear. Recall that the previous UK government wanted to decarbonise all transport road and rail: net zero rail by 2040 and only electric cars sold on the new car market after 2035.

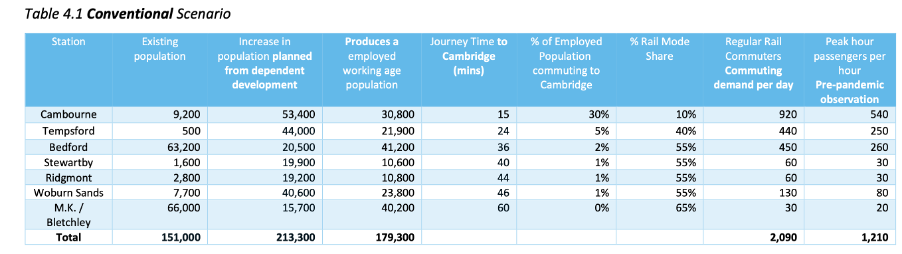
Based on the EWRCo. trip end model (ETR appendices table 4.1, repeated in Table 3 below) EWR would transport 2,090 people daily to Cambridge. Using this model we estimate 472 of these people would be existing residents shifting their mode of transport to rail while the remaining 1618 would be new residents. Assuming an average journey length of 30km, 220 days per year, EWR CS3 could reduce CO2 by 37.4 tonnes per year by switching from electric cars to rail (47-35 =12 gCO2/passenger mile). Over the normal assessment period of 60 years this would become 2243 tonnesCO2. for existing residents (and a further 7,689 TonnesCO2 for the new residents of EWR dependent housing). For those of you that believe EVs will never happen, even over the next 70 years (I am not one of them) the figures for diesel/petrol cars to Network Rail trains would be (171-35)/(47-35) = 11.3 times higher and still would not affect the conclusions of this article.
In discussion with an activist from the local green party, we came up with a rather conservative transition to electric vehicles which assumes a linear transition from 2010 to 2065 and that EWR would start service in 2035. This leads to an average car figure of 63.91 gCO2 per passenger mile and it is this figure that has been used in the summary. As we see with Eurostar, we can expect the emissions from EV’s to drop with time as electricity generation moves away from fossil fuels. This would also be true for rail and I have not allowed for this in the comparison.
For convenience I have copied the EWRCo. housing table below in Table 3.
Construction CO2 for HS2 Phase 2a and EWR CS3
The Government published an assessment of this for the now cancelled HS2 Phase 2a here. In section 7.1 we find this table.

The main figure here is the 1.451 million tonnes of CO2 equivalent (MTCO2e) and an assessment of the CO2 savings that are likely from modal shift to rail. Unfortunately, in the case of HS2 Phase 2a the CO2 from construction is much bigger than any saving from modal shift. This is despite the modal shift CO2 saving from the replacement of internal flights (presumably between London and Manchester) with rail.
HS2 Phase 2a was planned to run for 37 miles from north of Birmingham to Crewe (see here §1.1.4) a rather similar distance along the track (called chainage) as planned for EWR CS3 which we learn from the recently released Costain constructibility study is around 38.5 miles. So if we make the assumption that construction CO2 from HS2 phase2a is similar to EWRCS3 and just scale for the slightly different route length, we can estimate the construction CO2 for EWR CS3 to be 1.51MTCO2e
EWRCo’s Assessment of EWR CS3 Construction CO2
EWRCo. released under FOI an assessment of construction CO2 for a southern approach to Cambridge as also one for a northern approach. The figures are considerably lower than the estimates for HS2 Phase 2a and here they are:

So the estimate for EWR CS3 with the southern approach to Cambridge is 0.3225MTCO2e which is only one fifth of the HS2 Phase 2a derived estimate described above. Notice how much lower the northern approach to Cambridge is also. Is there really a 5x difference between EWR and HS2?
This entry is the table of limitations in the same document indicates where some of the disparity comes from (see below). They have not included the viaducts and for the earthworks they did not add the carbon from transporting and disposing the soil. These EWRCo. estimates are primarily to compare the southern and northern approaches to Cambridge, the absolute CO2 emissions are likely to be considerably higher and perhaps closer to the HS2 Phase 2a figures.

Let’s go with the lower EWRCo. estimate for now.
Assessment of EWR CS3 for existing residents
Let’s compare those estimates:
- EWR CS3 construction : +322,500 Tonnes CO2e
- Modal shift EV to Rail over 60 years: -5,403 Tonnes CO2e
So the CO2 savings are outweighed by the construction by a factor of sixty.
If EWR were to get to the point where people commuting to Cambridge did not need to use the roads or cars at all, then we could talk about saving the construction CO2 of new cars (the roads are already built so too late for that). This does not seem that likely.
Whereas car journeys are often door to door, heavy rail (like most public transport) involves first and last mile legs of the journey. This is one of the reasons that the passenger numbers for short commutes are low for EWR. We have not included CO2 emissions from these first and last mile journeys in this assessment – again being generous to EWR.
Assessment of EWR CS3 with new housing growth.
EWR CS3 is planned to support the growth of “EWR dependent” housing. My quotes are because the percentage of people actually using the railway from these new houses is so low that they are hardly EWR dependent. However, from table 2 above there are assumed to be houses for 213,300 people which equates to around 100,000 new homes at 2.1 people per household. The CO2 emissions from the construction of a small new house were assessed in 2010 and reported in this article to be 80 tonnesCO2e per house. so in total that would be 8.126MTCO2e for these 100,000 new houses.
But of course now there is more modal shift since a further 1,618 people are regularly using EWR to commute to Cambridge. Scaling from the previous result for the modal shift from existing residents, as we saw earlier this would lead to a further 18,523 tonnes of CO2e saved. However, we don’t know where the new people came from, they might have been moving out to a more rural location from a city in which case the benefit from modal shift might be rather less since they might have been using rail in their old job.
Again this is dwarfed by the construction CO2 from the railway and the new houses.
Sunk Costs
Once a railway has been constructed and also whatever new housing and places of work, then from a CO2 perspective, it makes sense to use it as the construction CO2 has become a sunk cost.
Particulates
There are other potential benefits for rail over road and this article has just focussed on CO2 emissions for a new railway built to support new housing.
Road tyres produce particulates which can cause health problems local to those roads. The steel train wheels and rails do not do so. Unlike CO2 which is a gas and spreads everywhere, particulates settle out locally and the larger they are the more local the effect. Consequently road tyres do present more of a long term health hazard on urban roads, especially in large cities and this would be a reason to reduce their use in such places. For heavy rail outside large cities this is much less of a consideration.
Conclusions
- CO2 emissions from the construction of EWR CS3 greatly exceed the reduction from modal transport shift for existing residents.
- CO2 emission from the construction of new houses greatly exceeds the reduction from modal transport shift for new residents.
- If, like the outgoing rail minister, you think that the houses will be built anyway, then there is clearly no business case for the railway, but this analysis also shows that building the railway still makes the CO2 emissions higher than just building the houses.
- I find the starkness of this result quite surprising so I would be delighted if someone can tell me where it is substantially wrong.
See table 1 at the start of this article for a summary of the numbers. If you can’t refute these numbers please do not say that building EWR CS3 is a contribution to tackling climate change. It looks like a disaster for climate change.
8 replies on “EWR Bedford to Cambridge: Does it reduce CO2 emissions?”
If these figures are correct and I am sure someone will be checking them, then the country would be substantially better off if it spent the proposed cost of £6 to £8 Billion, (our money) on the NHS, for the benefit of the whole population.
A well thought through analysis that asks serious questions for the incoming CEO of East West Rail
The Green Party candidate for South Cambridgeshire is on record saying he “obviously” prefers railways to roads, but this analysis shows there’s nothing obvious in adopting such a position. Politicians really need to do much better to educate themselves.
South Cambridgeshire Green Party candidate TBC, according to Green Party website – https://www.greenparty.org.uk/our-candidates.html . It appears he has stood down – watch this space!
I am now confirmed as Green Party candidate (and papers plus deposit accepted by SCDC today).
Unfortunate that when politicians think something is a good idea they
tend not to deviate regardless of facts. It takes courage to defy a major
Influential lobby who place their interests above all else. Especially if their
Party thinks some short term kudos is to be gained.
Brexit is a great example of this effect – it seems politicans like Pippa Heylings and Luke Viner have learned absolutely nothing from the Brexit catastrophe and seem hell-bent on repeating the same simplistic stupidity with EWR.
£8bn (say £12bn when done) is enough to build 2.5 gigafactories for making Lithium ion (or better Sodium ion) batteries. A gigafactory costing 2.5 to 3bn all made would supply over 25% of the UKs cars.
So, the amount of money for EWR would be able to change the entire UK car industry to EVs to be powered by renewables.
I used to work in LI-ion material technology and battery production is esential for UK to be able to have any vehicle industry.